A GIS analysis of potential planting locations for Sequoia Sempervirens in Marin County
Researchers’ Names and Institutions:
Project Head: Elizabeth Villano, Climate and Redwood fellow, Turtle Island Restoration Network.
Supervisor: Preston Brown, Director of Watershed Conservation at Turtle Island Restoration Network. Special thanks on GIS technical support to Tyler King, Civil and Environmental Engineering Doctoral Research Fellow at Utah State University.
Introduction:
The Coast Redwood (Sequoia Sempervirens) has long captured the hearts and imagination of people all over the world. Aside from their grandeur and beauty, redwood forests are unique in that they can sequester three times more above-ground carbon than any forest in the world, including the giant Eucalyptus forest in Australia, and the Amazon Rainforest1. S. Sempervirens are already constrained to a specific range along the Pacific Ocean from the southern tip of Oregon stretching into Monterey County of central California. This area is within the “fog belt” of the Pacific Coast, and is 450 miles long, and 5-35 miles wide5. Unfortunately, due to a high demand for its timber and habitat loss, only 5% of old growth forest remains. In Marin County, just an hour north of San Francisco and home to the famous Muir Woods, the original range has been especially impacted due to its close proximity to the city center where historic logging was ubiquitous. Turtle Island Restoration Network has undertaken a project called the 10,000 Redwoods project as a multifaceted approach to restoring the redwood range in the San Francisco Bay Area. This project aims to reforest redwoods as a carbon sequestration initiative, educate people about climate change, and involve people in citizen science and riparian restoration projects. In our native plant nursery, we have upwards of 1500 redwood seedlings, many of which are ready to be out-planted. In order to target areas of the County for reforestation, beyond our current restoration project, we undertook a GIS spatial analysis project to identify the potential locations for redwood reforestation in the County. The GIS model includes many factors considered necessary to support redwood growth. For more information, or to join our initiative, visit 10000redwoods.org
Literature Review of Factors Needed For Redwood Habitat:
The GIS model is intended to help guide reforestation initiatives. It relies on factors entered into a computer model that influence growth and thus, success of redwood reforestation. Each factor entered into the GIS model was determined based on an extensive literature review of factors S. Sempervirens need to grow. When possible, the factors were confirmed from mulitple different sources. Below is a discussion of these factors:
Elevation/slope: While there are no distinct slope or elevation requirements for redwoods, a common theme is that less is better. Redwoods can grow on slopes of 0-42%, but the largest and most productive stands are found on lower slopes below 15%4. Many of the most recognizable stands are found in alluvial flats (very minimal/low slopes), as redwoods can adapt to shifting water levels by growing parallel root systems and outcompete other species. Redwood growth is typically negatively correlated with elevation, with the largest stands found in low elevation areas. There is also a relationship between elevation and slope. Above 1000 feet, slopes often become steeper, and less nutrients or water are retained in the soil, which impacts growth negatively 7,8. Most productive redwood stands are found below the 1000 elevation marker.
Soil: The optimal p.H. for a redwood stand is 6.5, but they can grow in a range of soil from 5-7.52,3. They prefer an organic matter percentage of 6% on the top layer of soil, and 1-2% below 10 inches 4. They grow well on ancient alluvial flats. The parent material for many sites is sandstone, but can be shale, limestone, Franciscan slate, or chert 5. Many redwood-dominated forests have a distinct borderline, which usually indicates a dramatic shift in soil type. Redwoods cannot tolerate serpentine, the Yorkville soil series, or soils high in magnesium or calcium. Additionally, soils that are in an established grasslands tend to create an unfavorable environment for redwoods5.
Aspect/solar radiation: Redwoods cannot tolerate large amounts of direct sun. In fact, redwoods have poor stomatal control in dry environments, and it is common for their needles to lose 10% of their moisture content on warm summer days10. To prevent water loss, they tend to grow on north or east facing slopes, or in protected valleys 5,6.
Precipitation/fog/evapotranspiration/soil moisture: Redwoods require large amounts of water, both in the summer and in the winter seasons. The typical amount of precipitation in a redwood forest is between 25-115 inches/year 3,4,. While precipitation is important, research has shown that winter rain is less crucial to redwood health than the amount of fog in the dry, summer months. Redwoods obtain anywhere from 30-40% of their total water intake from summer fog3,4. They either directly absorb it through their top needles, or “comb” it out with specially formed needles and divert the water down to the forest floor 10. Fascinating studies have shown that the water level of understory plants actually significantly decreases without redwoods 9, despite all of the water they require, because of their ability to to absorb fog. In addition to the fog providing moisture during the dry season, fog also reduces evapotranspiration during the peak hours of solar radiation. Fog rates and evapotranspiration are directly correlated, and both were considered in this analysis. Similarly, soil moisture percentage is an important factor that encapsulates many variables of the water redwoods need to survive. The ideal soil moisture percentage for redwoods is 60%. Redwoods can grow in soil anywhere from 18-86% saturated 2,11.
Geography: Redwoods require specific geographic conditions to grow. One consideration is plate tectonics: in Marin, there is an direct divide between the Pacific plate and the North American plate. The granite underlying the Pacific Plate is not conducive to redwood growth, whether through p.H., soil composition, associated bacteria, or other factors. Another geographic factor is the salinity of the ocean spray: redwoods cannot tolerate being in close proximity to the ocean, as the salt burns their foliage and changes the soil chemistry 5,11.
Methodology:
The GIS modeling used was in accordance with the U.S. Fish and Wildlife Service’s Habitat Evaluation Procedures Handbook 12. In this procedure, a weight is assigned to each factor incorporated into the dataset that indicates how important it is for the habitat. The factors are all then compiled into a calculation of a habitat feasibility score of each pixel on the map. For this purpose, the habitat feasibility score will be called the ‘redwood feasibility scale’.
The GIS model used for redwood habitat is comprised of the following 7 factors:
1. the percentage of saturation in the soil column (soil moisture),
2. type of soil and parent material, slope, and elevation (soil type),
3. amount of yearly precipitation (precipitation),
4. amount of daily fog (fog),
5. the aspect and amount of solar radiation (solar radiation),
6. what tectonic plate it is on, pacific or north american (tectonic plate), and
7. amount of evapotranspiration from the site per year (evapotranspiration).
Each dataset was reclassified into groupings based on natural jenks, or breaks in the data. These groupings break down each factor on a sliding scale, with larger numbers representing better habitat for redwoods. For example, fog in Marin ranges from 3.19-13.2 hours of fog or cloud cover/day average in the summer. This range was broken into 5 groupings:
1
2
3
4
5
3.19-5.19
5.19-6.83
6.83-8.92
8.92-11.19
11.19-13.2
Example of hours of fog or cloud cover per day. Each cell was assigned a value from 1-5, with 1 being the least suited for redwood growth and 5 being the most suited.
In total, 16 different analyses and maps were created. The data consist of rasters, or groupings of small individual pixels. The raster look like a heat-map, with areas most suitable for redwood growth on a scale from 14-60 (the redwood feasibility scale), higher being more feasible habitat. It is visually represented on a sliding scale from red to blue, with cool colors being the most suited. Each raster was tested for its validity using the intersect tool, which compared the GIS created map with all known redwood stands in Marin. This calculated the percentage of actual redwood habitat in each pixel compared the redwood feasibility scale. The raster with the strongest correlation between the redwood feasibility scale and percentage of known redwoods was selected, based on the assumption that it best calculated the factors redwoods need to grow, and could best predict future planting sites.
Source Data:
Solar moisture data is the Monthly Projected Fractional Moisture in the Entire Soil Column (SMCL). It was taken from Cal-Adapt, a compilation of data created by the Climate Action Team headed by the Secretary for Environmental Projection of California. In Marin, the range of values was from .29-.58 percent of porosity. This was reclassified into 5 groupings, and values with higher percent soil porosity being assigned higher numbers. Data was taken from the projection of June 2019, with the idea of incorporating in a climate projection for future plantings.
Evapotranspiration is the Monthly Projected Actual Evapotranspiration, taken from Cal-Adapt. In Marin, values ranged from .0026-80.6727 mm/month. This was reclassified into groupings of 1-5, with higher evapotranspiration assigned to a lower number.
Soil data was sourced from Marin Map, and was conducted by the CA Soil Resource Center. It provides a detailed raster of soil types, and can be broken into many distinct categories. In Marin, there were 106 distinct soil profiles (including differences in slope ranges). Each soil was reclassified as 1-5, with 5 being soils already associated with redwood forests, and 1 being soils that were grasslands, improper pH or drainage levels, or completely unsuitable for redwood growth (such as serpentine outcroppings). The soil profiles in Marin were graded on organic matter, pH, slope, plant community, drainage, and parent material. In general, plant communities that already sustained redwoods were given a score of 5, and areas with poor drainage, grasslands, heavy clay, or unsuitable pH were give a 1. Data was taken from the CA Soil Resource Center and graded on this sheet.
Precipitation was taken from PRISM Climate Group, and calculated the 30 year average precipitation levels, in cm/year. In Marin, the values range from 500-1717 cm/year. This was reclassified into groupings of 1-5, with higher precipitation values being assigned higher numbers.
Fog data was taken from California Landscape Conservation Cooperative Climate Commons, and measured the decadal summertime fog and cloud cover. The values were measured in hours of fog/day in June-September, averaged from 1999-2009. In Marin, the low was 3.19, and the high was 13.2 hours/day. Natural jenks, or breaks in the data, were reclassified as values 1-5, with the highest being more fog/day.
Solar Radiation was computed through ArcMap’s ‘Area Solar Radiation’ function, computed using LiDar Elevation data from Marin County. It was computed for the year of 2017, with 14 day intervals and .5 hour intervals. A Standard Overcast Sky was used. Solar Radiation was reported in hours of sunlight/year, and ranged from 26 – 4841372 hours/year. The data was broken into 5 natural jenks, and assigned values 1-5, with 5 being the lowest amounts of solar radiation received.
An additional factor was the prevalence of the San Andreas fault line running through Marin. Land to the west of the fault line was assigned a value of 0, as it is a granitic base and does not support redwood growth. Data was taken from a USGS survey of land faults. Land to the east of the fault line was assigned a value of 1, as it is composed of Franciscan Complex, a viable rock base for redwoods.
Time period Involved:
There were 7 datasets incorporated in the project, each of which had a unique timeframe. Some datasets have enough information to go back in time to 1929, and present a wide range of ‘normals’ for the given variable. Other datasets incorporate climate change predictions based on the “Business As Usual” model, and continue into 2099.
Geographic Extent of the Study Area:
This model covers Marin County, CA. A long-term project goal is to complete similar maps for all of the Bay Area.
Results:
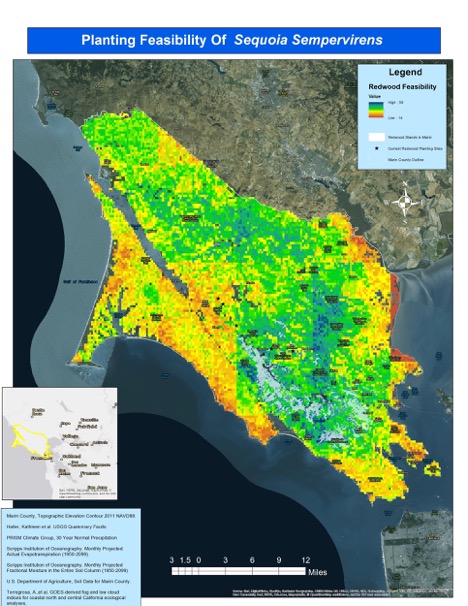
With the historic range of redwoods being so poorly documented, it is difficult for restorationists to know where to replant. The heat map style of this map outlines areas that are more and less appropriate to plant redwoods for our 10,000 Redwoods campaign. Each of our current restoration sites are on green squares, indicating a feasibility value of 30 or above (from a scale of 14-50). The raster used had an R2 value of .76, indicating a correlation between current redwoods and where the map predicted redwoods would best grow. The raster calculation used to get the final map was: evapotranspiration + precipitation + fog + ½ solar radiation + soil + plate tectonics + soil moisture. Other raster calculations were done playing with coefficients of each variable, however this was the strongest correlation. Many of the widely known redwood stands in Marin County were on areas that were dark green or blue on the map. The locations of Muir Woods, Samuel P Taylor, and Roy’s Redwoods all ranked highly on the redwood feasibility scale.

Table 1: The correlation between redwoods currently in Marin County and the redwood feasibility scale.

Image 1: Raster 9, the raster that had the highest correlation between the redwood feasibility score and current redwood sites.
Discussion
The GIS map can help us tailor our approach to redwood restoration sites, and target areas higher on the redwood feasibility scale to ensure the best chance of redwood survival.This method relied on the assumption that if the redwood feasibility score correlated strongly with areas where redwoods actually grow, there would be a strong foundation to determine redwood planting and reforestation areas. However, it is important to note that correlation does not equate to causation, and additionally that a high correlation is not necessarily applicable to prediction. When attempting to model a biological system, it is extremely difficult to create a 2-D replication of what factors contribute to an ecosystem. Some factors may be strongly correlated, but not contribute as much in real life. In modeling a redwood ecosystem, it was feasible to change the coefficient of some factors completely, but still receive similar R2 values. This highlights the difficulties of ArcGIS modeling in general: it is hard to know the exact importance of contributing factors relative to one another. While the model used is the most commonly used habitat mapping tool for GIS, it has its drawbacks. Typically in these models, a biologist assigns a value to each factor being used in the analysis. When values were assigned, misinterpretations of the literature could have occurred. Additionally, this model relies on precise and detailed datasets for each important factor, which may not be correct. Some factors are harder to measure in smaller spaces than others. For example, evapotranspiration is measured over large ranges, and should be interpreted with hesitation in smaller and more precise areas. Soil data, on the other hand, has had large amounts of resources and money, and can be assumed to be more precise.
Many of the factors used in this analysis could have easily been applied to other tree and vegetation species as well. While the this GIS map was specific to redwood habitat, many other dominant tree species, such as Douglas Fir, could also thrive in these factors. Thus it is uncertain whether this map is specific to only redwoods, but could be applied to other species that grow in association with redwood, such as Douglas Fir, bay-laurel, or tanoak . The analysis attempted to account for this factor by correlating the redwood feasibility factor to where redwoods are actually growing now, however, the variance should still be considered.
In other GIS models for habitat prediction, similar R2 values were used, some above and some below the .76 value of this map 13,14. Corridor Design, a project to improve Habitat Corridor mapping on GIS, approximates an R2 value of .7 for most maps, as “given the low accuracy of land use layers and incompleteness of the set of available factors, we guess most models are no more than 70% successful”15. It is also interesting to note that solar radiation was halved on the raster calculation used. Redwoods are notoriously bad at maintaining their moisture in direct sunlight, so it is strange that the raster calculation that gave the highest correlation of their growth was when the solar radiation was cut in half. One hypothesis as to why this was the case may be that it was the dataset was the most robust. The coarseness of other datasets may have normalized the correlational value to an extent that masked some of the abnormalities.
Future Questions
1. How can this data be applied to a community wide restoration project?
Further analysis of the GIS model can point to overlaps between high potential restoration sites (anything above 30, or green colored), and potential community partners. A large scale outreach campaign can target schools, landowners, community centers, parks, and other landowners to join the 10,000 Redwoods Campaign as citizen scientists and restoration contributors. This modeling initiative must be the source of discussion with community partners to inspire their participation in the 10,000 Redwoods Campaign.
2. What implication does this model have on other ecosystem analysis using ArcMap?
As pointed out in the discussion section, it is difficult to model a complex ecosystem in a 2D fashion, especially when relying on accurate, precise, and available GIS datasets. In this method of ecosystem modelings, a biologist assigns importance scores to each factor used in the model. This system leaves room for human bias, and feasibly could provide a strong correlational value without the “correct” coefficient values based on what redwoods actually want to grow. For example, a raster calculation halving the influence of fog, doubling the influence of soil type, and halving the influence of solar radiation gives an R2 value of .65, and an entirely different looking map. At some point in switching around factors, one is bound to see completely different looking maps with similar correlational values. It is impossible at that point to determine whether which raster calculation is more correct, and which is chance. Regardless, the GIS mapping provides a source of dialogue and a quantitative approach to where to begin redwood reforestation.
Literature Review Sources


